


Introducing presentation analytics


Presentation analytics is a key pillar of our product vision to build the complete platform for presentations. Today, we’re rolling out presentation analytics to every Pro workspace. Here’s how you can use analytics today, and how we’ll be expanding the feature over the coming year to deliver even more powerful insights. Update: With the launch of Pitch 2.0, we’ve revamped presentation sharing and added new features like the links overview page, which makes it easier than ever to manage your outreach and track engagement.
Presentations, at their core, exist to help teams turn their best thinking into stories that drive results. But many presentations are never presented live, so how do you know if your ideas have made an impact? When you’re fundraising or selling, you might rely on a separate tool to get insights into who’s viewing your work. In the process, you’re adding extra steps to your workflow, and paying extra for the privilege.
With Pitch, presentation analytics are baked into the core experience. So you can go from idea to insight to impact without duct-taping a separate stack. If you need to tweak your deck along the way, you can iterate from the editor instead of juggling exported files and multiple versions. And best of all? Analytics are available to all members in your workspace. Now everyone from the CEO to junior employees can tap into insights on which decks are getting read — when, where, and by whom.
See internal and external analytics in one place
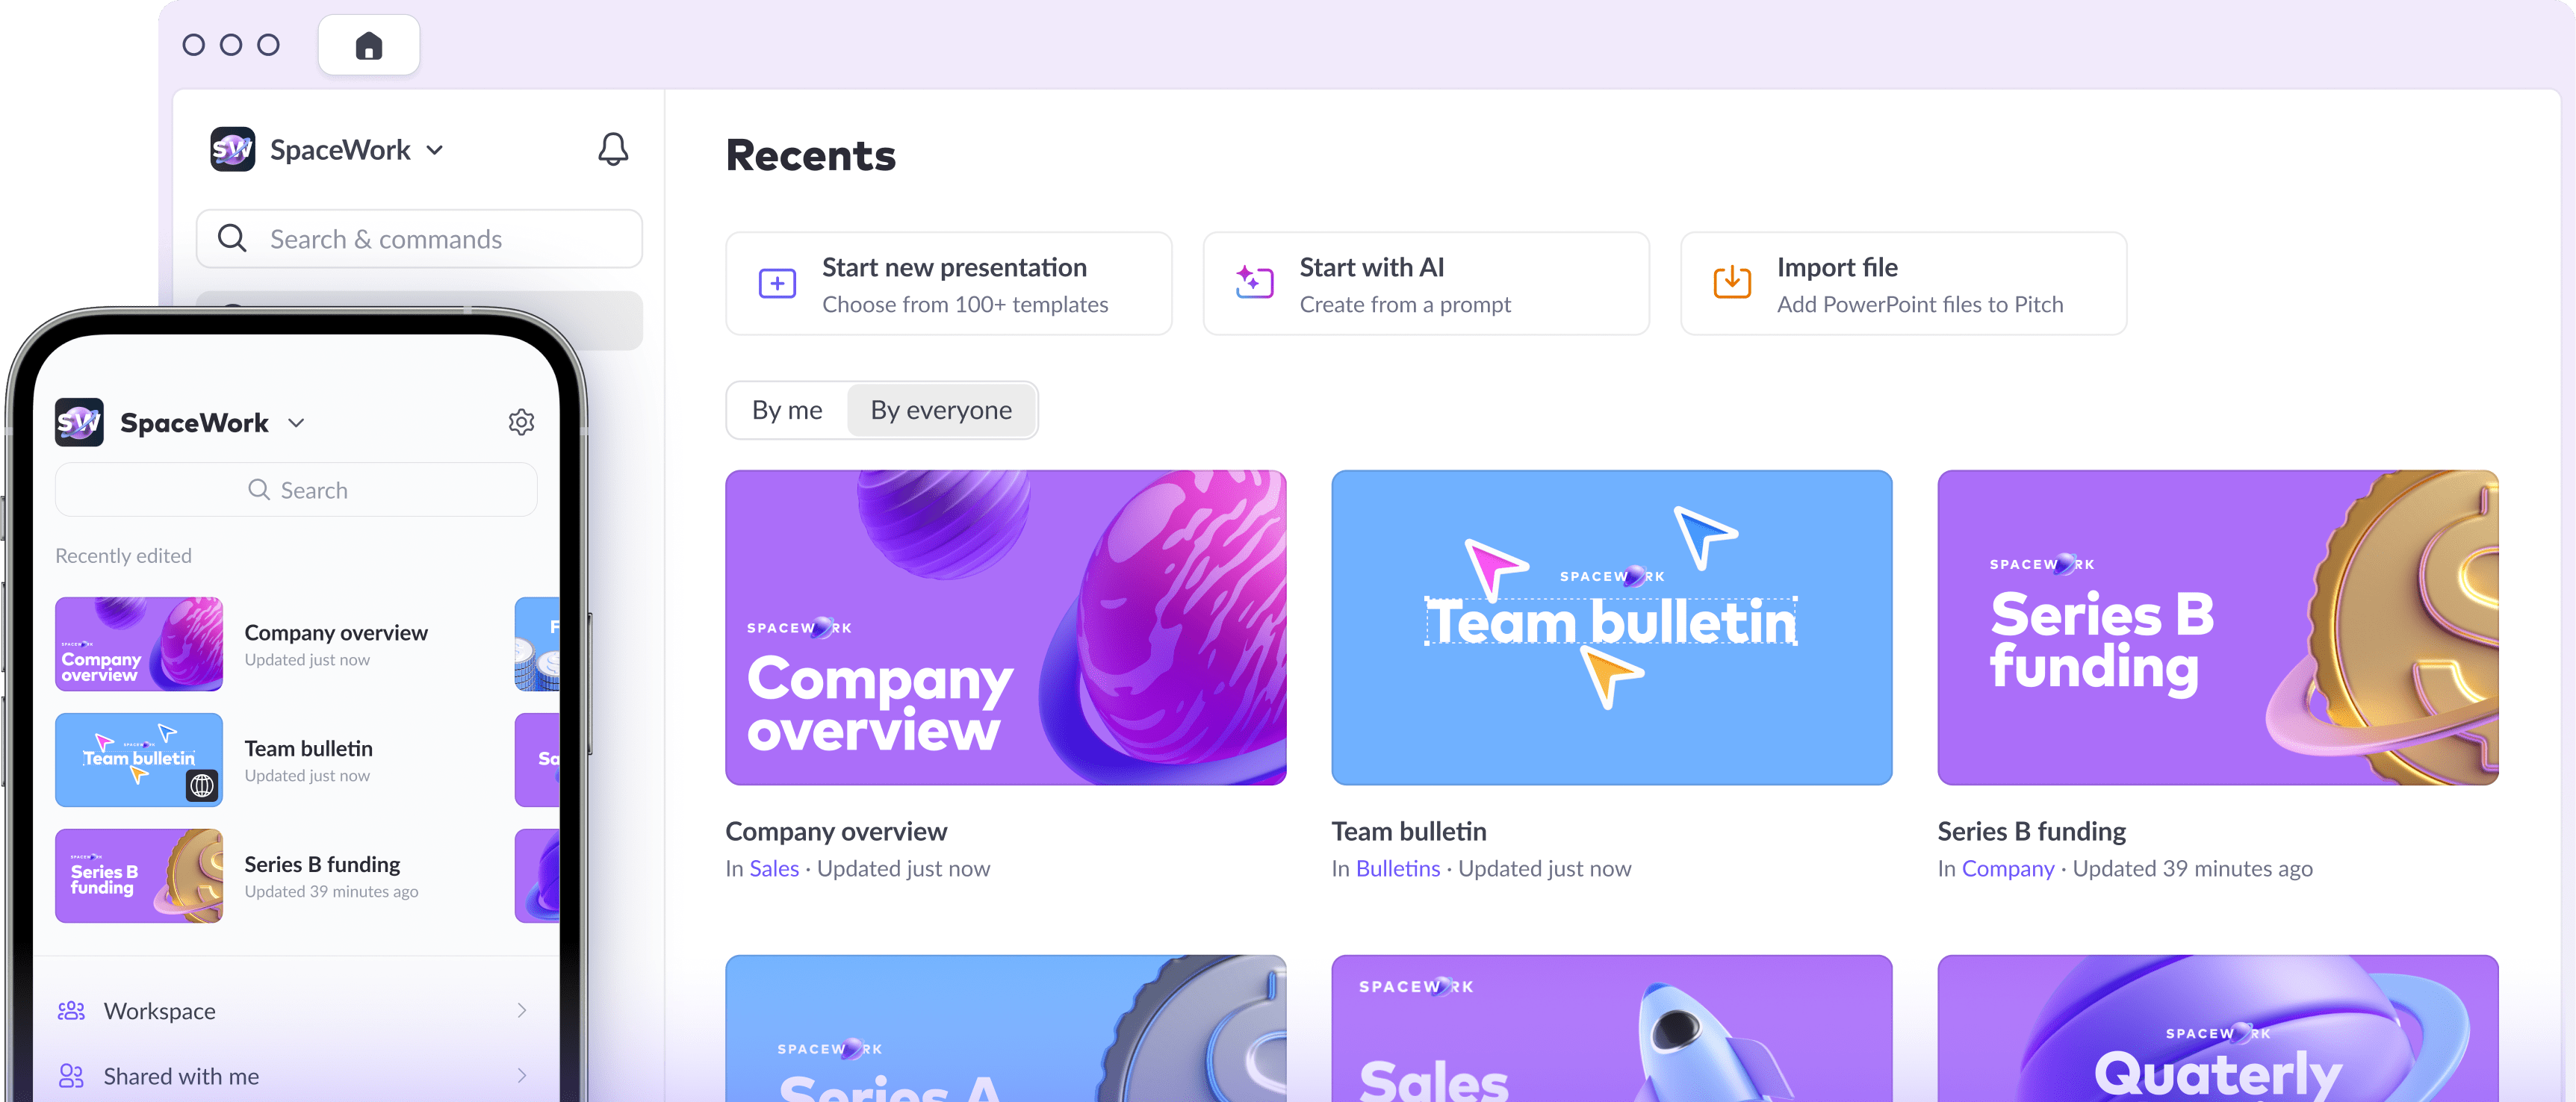
Here’s how to get started: Open any presentation and you’ll see a new analytics icon at the top of the editor. Click the icon to open the analytics menu, which combines visitor activity from members, guests, and external audiences.
See a feed of visits, complete with location, device, and timestamp, so you can see when and where audiences consume your work. If you’ve embedded a presentation or shared a public link, you’ll be able to view a chart of visits over time, to see when there’s a spike in activity.
Stay in control of sharing with custom links and passcodes
With this release, we’re also introducing custom links, a powerful new way to share your presentation with specific audiences. Instead of duplicating your pitch deck or passing around a single public link, now you can create multiple links for any presentation, each with a descriptive URL and optional passcode. If you’re on the go, you can even create a custom link from Pitch for mobile.
You can analyze each link separately, giving you greater insight into when a certain audience is viewing your presentation without compromising on data privacy. And if you need to stop sharing a deck with someone, you can disable individual links without disrupting how other groups access the deck.
For teams involved in winning new clients and partners, custom links open up powerful new opportunities to gain insights on messaging, pricing and more. "Whether we're leveraging Pitch for internal knowledge exchanges, or introducing high-value decks that bring brands over the line from prospects to Frontify customers, the enhanced visibility we have through presentation analytics gives us the insights we need to ensure we're communicating clearly and effectively," said Shannon Healey, Head of Marketing ad-interim at Frontify. "We can see what's resonating and with whom, and make quick adaptions to ensure we're hitting the mark.
What’s next: real-time notifications, slide-level engagement, and more
We’ll be further developing presentation analytics so you can zoom in to understand the performance of individual slides, and zoom out to understand your team's performance with a workspace-level dashboard.
You can expect incremental improvements over the coming months, starting with engagement. With slide-level analytics, you’ll be able to see how much time people spend with your deck, how many slides they view, and more. Insights in hand, you’ll know which slides are most captivating and where you need to sharpen your storytelling.
Next, we’ll focus on notifications. When you’re pitching something important, real-time updates are essential. Soon, whether you’re at your desk or on the go, you’ll get an alert when someone first opens a custom link.
Understanding the performance of an individual presentation is helpful, but what if you could surface insights from across your entire workspace? In the future, we want to give teams a comprehensive analytics dashboard where they can see trends across decks, understand how collateral is used, and make sure their team is tapping into the full power of Pitch. We think this will offer sales enablement, marketing, and operations teams a modern and centralized resource for supporting their stakeholders.
Get started with presentation analytics
If you’re part of a Pro workspace, you’ll be able to start working with presentation analytics right away. And Starter workspaces can look forward to a basic version of analytics in the future. Check out our pricing page to learn more about Pitch Pro.
We built presentation analytics to help founders fine-tune their fundraising, and help sales teams perfect their proposals. As we continue to develop the feature, we want to hear firsthand from you on the value it’s delivering, and how we can improve it. Reach out to support@pitch.com or start an in-app chat with us to share your thoughts and feedback. If you’d like to dive deeper on what it is and how it works, head to our help center for an overview.